Saturday, January 31, 2015

Oil Consumption Down from 1200 to 700 Gallons/Year

   Every environmentalist has one or two dirty little secrets. One of mine is that I burn diesel fuel (aka home heating oil) to keep my house warm and supplied with hot water.

    What can I tell you, there is no natural gas available on my street and I have not yet jumped into the geothermal camp.

    To minimize the amount of fossil fuels consumed at my house, I have done a little bit of work to both track the usage and see that it is well used.  Being able to quantify a problem is often the first step in fixing it, and so it is the case with oil consumption.

    There are a few of little issues that make tracking oil consumption more difficult than, for example, electricity consumption.

  1. Timing:  The oil tank does not get filled at a consistent time interval. so there is no way to know how much oil has been used in a given month or even year.
  2. Weather: Most of the fuel oil is consumed in heating my home (the rest goes to hot water).  There is significant variation, from one year to the next, in the amount heating is required.
  3. Price volatility:  The price of oil fluctuates quite dramatically, so looking at the bill doesn't reveal much about how the home is performing in terms of efficiency.

Most of these issues are easy enough to deal with, using a little help from Microsoft Excel.

  1. Time Intervals: Each time the oil guy comes, he fills the tank to the top.  So the fill-up days are the only points in time where the fuel usage is know.  The fuel that has been consumed, has obviously occurred during the time period between the current fill-up and the previous one.
  2. Years: But that still makes it impossible to compute how much fuel is consumed in a year.  Traditionally, the start of the heating season is considered to be September 1.  So the first fill-up after September is considered to be split between two years.  The number of gallons consumed between fill-ups is split proportionally between the two years based on the number of days.
  3. Heating Degree Days: Trying to look at oil consumption based solely on time is very confusing.  Because weather is as much a factor as time, the concept of a "heating degree day" was invented.  A heating degree day is the product of the number of days and the number of degrees below 65°F on that day.  For example, if the average temperature on a given day is 55°F, it is considered to be a 10 HDD.  It really makes more sense to compare oil consumed with the number of HDDs.
  4. 6400 HDD: Now that there is a method to calculate the amount of oil consumed in a year, there is one more problem to address which is that not all years are created equal.  For that reason, the data is curve-fit and the amount oil that would have been consumed for a typical 6400 HDD year is computed.  Only by normalizing the years to 6400 HDDs can a direct comparison be made from one year to the next.

The figure below shows the amount of oil consumed in the 2008-2009 heating season versus time in days.  The curve has an 'S' shape that is due to the days getting colder in the middle of winter.  It also has a linear shape in the summer (say after day 250) that represent oil being consumed to produce hot water.
If that same data is plotted against heating degree day, as shown below, the S-curve becomes very straight which makes it much easier to perform curve fitting on.  In order to estimate how many gallons would be consumed in a typical 6400 HDD year, a linear curve is fit to the data below and the corresponding number of gallons for 6400 HDD is computed.
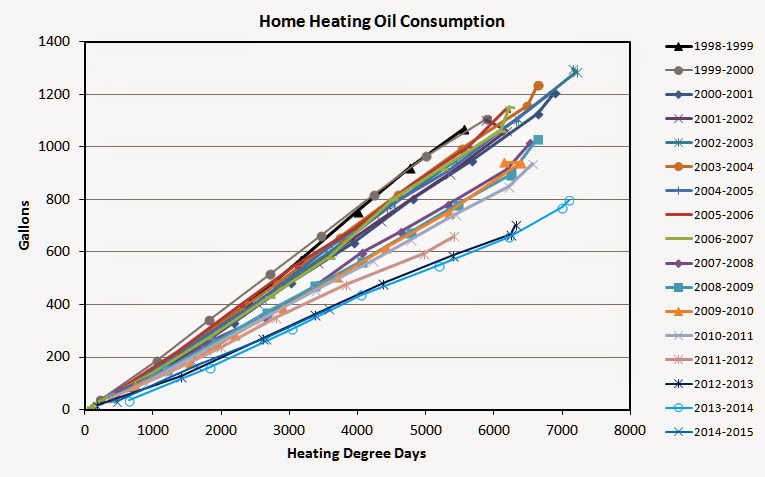
Looking at the curves of all the years, as seen in the figure below, is very confusing.  But note that in the earlier years (black and gray lines at the top), the oil consumption was much higher than it is more recently (blue curves at the bottom).  But normalizing this data to a 6400 HDD year tells the story more simply.


 After the curve fitting and computation of gallons consumed in a 6400 HDD year, the data looks much cleaner, as shown in the figure below.  Shortly after we bought the house (1998) fuel consumption exceeded 1200 gallon per normalized year.  The consumption dropped closer to 1100 gallons per year over the next several years as our bath taking babies turned into shower taking children.

   In 2006, my wife contracted with a company to perform air-sealing and install blown-in cellulose insulation in the walls and ceiling.  The impact was dramatic.  Oil consumption dropped a couple of hundred gallons per year.

    Over the next few years, small improvements were made, including

  1. Three Andersen windows in the master bedroom
  2. Two Innerglass storms in the guest bedroom
  3. Insulating the build-in bookcases that abut the garage.
  4. Insulating the concrete basement walls in the playroom.
  5. Installed an insulated sidelite panel for the front door.
  6. Turned down the furnace from 180°F to 140°F to reduce standby loss
  7. Installed low-flow shower heads and sink aerators 
And perhaps just as important, starting in 2009 the two children started heading off to college which reduced the need for hot water.  So some significant part of the reduced fuel consumption isn't reduced so much as shifted to another location.  But, hey, it makes my graph look good so I'll take it.

In 2012, I installed a solar hot water heater which is detailed in a separate blog "Into Hot Water, Solar Hot Water"  This further reduced the oil consumption.

The combined efforts have reduced fuel consumption from over 1200 gallons per year to about 700 gallons per year, which is a big step in the right direction.

Looking forward, I'll be insulating more of the concrete basement walls and eventually get to some of these poorly insulating doors and windows.


Wednesday, January 28, 2015

IR Thermal Image Out-Takes and Questions

    Exploring your house using a thermal imaging camera can provide some great insights into heat loss in the home, but it can also yield some surprises.  Below are some of the images that surprised me.
    It certainly shouldn't be surprising that running electrical devices are hot, but it still surprised me to see how warm my wall phone was compared to the wall around it.  It looks like the electronics are on the right size of the phone.
    
And the nearby refrigerator is kicking out some heat on the lower right. Ironic that a device used for cooling actually creates heat, but that is how thermodynamics works.   Sometimes when we let our turtle roam the floor we find he parks himself at that location.

My two Dewalt battery chargers show how much things have improved over time.  The charger at the top of the image (middle really) is an older unit and is heating the battery.  The lower one is a modern Li-Ion charger that isn't hot at all. Both batteries were long since fully charged when the picture was taken so I don't know why the top one is continuing to be charged.
 Water steals a little bit of energy from the air when it is evaporating so wet objects are slightly colder.  I hadn't even noticed the drops of water on the floor unit they showed up in the IR image.

I was also surprised to see the towels on the front of the oven looking so cold until I realized they are put there to dry.  The "cold spots" really indicate the wet spots.

For IR cameras to work well, the objects they are imaging should have an "emissivity" value near one.  The emissivity of a surface of a material is its effectiveness in emitting energy as thermal radiation.  A perfect emitter has a value of 1.0 and real surfaces have lower values.  Fortunately a lot of different building materials have emissivity in a close range from 0.9 to 0.95 meaning that reasonable thermal images can be made without correcting for the emissivity of every different object in the image.
   But some materials are problematic, such as polished copper.  Polished copper has an emissivity of only 0.04 and the impact of that can be seen in the image below.  The copper pipes (which carry hot water for hydronic heating) in the image have been painted black over the middle section.  So temperature reading where it is painted black should be reasonable accurate.  In this case the yellowish color puts the temperature nearer the higher end of the scale which is 150°F.
   But in the unpainted section of the pipe, towards the right of the image, the color is a very dark purple which would put it closer to the low end of the scale, 56°F.  This is obvious a big discrepancy and something to be careful about when imaging shiny surfaces like metal.

There is also the possibility of getting a reflection in a surface just like taking a picture in a mirror.  In an attempt to image a glass door, I got the image below which shows my thermal image reflected in the surface of the glass.  It is unfortunate that glass has this issue because windows are one of the places that I would really like to get good thermal images from because they are a significant source of heat loss from my home.  I guess the lesson here is to interpret images taken from glass surfaces very careful and with some skepticism.

One area of my home that I've been working to insulate is the concrete basement walls.  After I finished insulating them, they were much better but still were warmer on the outside than I expected.  So there might be something else going on with the concrete than just conducting heat out of the home..
   The two images below are of large rocks or granite in the neighborhood.  The rocks are much warmer than the surrounding earth.  So what is happening?
    Here is what I think is going on.  These rocks are buried deep into the ground and it is reasonable to expect that they are in good thermal communication with underground soils which are probably 50°F at a level of 4 feet underground.  So perhaps the rocks are conducting some of the heat out of the deep soil to the surface.  
    Possibly the same thing is happening with the concrete foundations walls of my home.
    One thing is for sure, the heat seen from these rocks is not lost from any home because they are far from any home.  So there are some naturally occurring variations in temperature that will be seen outdoors.


   The final set of three images calls into question the accuracy of this FLIR i7 camera.  The camera has the ability to "lock" the scale so the min/max temperature range doesn't change with every image.  For these images, the scale was locked between 9°F and 20°F.  But it is clear that the images are dramatically different despite being taken within seconds of each other of the same area of the house.  I suspect this is some sort of thermal calibration (for the sensor temperature) that is not working well.  But it is a very unfortunate defect in a $2000 camera and can make a mess of a series of carefully taken images..  If anyone knows what the issue is (operator error perhaps) please let me know.


Tuesday, January 27, 2015

Temperature Measurements of Windows

   Normal people buying a 1950's range home hire someone to rip out all the old windows and put in double pane replacement windows within the first year or two of ownership.

   Well let's just say that I'm not a normal person.

    For one thing, I don't really like replacement windows.  In my mind, they are just not right.  In order to save effort, the replacement windows sits inside the old frame.  This means that the new window glass area is smaller than the old window glass area.  It also means that the pockets containing the window weights don't get dealt with and any pre-existing issues with trim leakage are not fixed.  The replacement windows can also be very expensive.  I got a quote that amounted to $1500 per window installed.

   So I decided to take a crack at installing some "new" (not replacement) windows myself.  I put two double hung Andersen windows in the Master bedroom and one in the master bathroom.  The results are mixed.  The new windows look great and operate great.  They are a big step forward compared to the old windows and storms.  But the insulating quality is just not that impressive.  The windows are roughly R3 which is nowhere near as good as the walls and glass still has some condensation issues as a result.  Also, I spent about $600 per window between the window itself and the supplies.  It should be said that there are less expensive windows and I purchased the windows that I wanted rather than shopped on price.

   Seeking an alternative, I found something called "innerglass" (http://www.stormwindows.com/).  This company's main focus is to supply "storm windows" for historic homes.  Storm windows are typically not allowed in historic homes because it changes the appearance too much.  Innerglass storms are installed on the inside of the window and use a compression seal to seal to the window frame.  The innerglass storms are all but invisible, seriously.
    But I had a different idea of how to use these.  I already have outer storm windows and wondered if I could improve my windows by adding an additional inner storm window.  I purchased two of them (about $210 each) a couple of years ago and I think they are great.  They definitely improve the old windows, but they are even better than the new windows because there is effectively triple glazing.
    On the down side, you don't really have an openable window with the innerglass installed.  This is not a problem in the winter, but in the summer I remove them so I can open the window.  Also, there is probably a fire safety compliance issue because bedroom windows have to be a means of egress.  While I do have these in our guest bedroom, it is almost never used so I don't worry about the compliance issue.

   In addition to some new Andersen windows and two innerglass windows, there are a number of old windows in the house.  My home is really an experimental playground for windows.  One cold day (today actually) I took some data.  First I put a Post-it note on the glass of each window of the house (somewhere in the middle) and let it reach temperature.  Then I used an IR thermometer to measure the temperature of the Post-it note.  The reason for the Post-it note is to overcome any emissivity issues that I might have taking IR measurements on glass.

   The dramatic results are shown below. (larger numbers are better)

63 °F double hung: single pane/storm/innerglass
62 °F single pane/double pane
61 °F New Andersen double pane
55 °F Fixed: single pane/storm
50 °F double hung: single pane/storm

At 63°F the best results came from the old single pane windows with storms that I added innerglass to.    This effective triple glassing is actually better insulation than getting new double pane windows.  It is also much less expensive.  The downside is that the windows are not really openable and the innerglass panels must be removed and reinstalled on a seasonal basis.

At 62°F is one small sidelite window on the front door where I have added a custom double pane storm to a single pane window. see post here http://doublepane.blogspot.com/2013/03/storm-window-for-sidelite.html   Again, triple glassing is effective.

At 61°F is the New Andersen windows.  We should give them their due.  They are certainly a big step up from the old windows.  But they are still a far cry from the 70°F surface temperature of the wall near the window.  In other words, the Andersen window suck, just not as bad as my old windows.

At 55°F is the two large fixed pane picture windows with fixed storms that I have at the front and back of the house.  This is pretty bad because not only are the windows poorly insulating, they are also very large.

At 50°F is one of my old double hung single pane windows with storm window.  So it is clear that the Andersen windows are a big improvement, just not as big as I would like them to be.  I have four of these old double hung windows left in my house, one in the guest bathroom and three in my son's room.  I really need to do something.  I wonder if Andersen makes any triple glazed products.

Shades
One final test was to repeat the temperature measurements after pulling the shades down.  This was only possible on the Andersen windows which have thin roller shades and on the large picture windows which have double honeycomb shades which are sold as highly insulating.

The roller shades decreased the surface temperature by 2°F indicating they provided only a small insulating value.

The double honeycomb shades, on the other hand, decreased the glass temperature by a full 8°F showing their great insulating value.  However, it should be noted that this exacerbates condensation issues on the glass because the glass temperature is even colder.

Thermal images of the doors

It is easy to get a little carried away when shooting with an infrared camera, and I did that shooting over 300 images in a couple of hours.  To try to make sense of them, I'll focus on a few areas at a time, each in their own posts.  The first area will be the doors as seen from the inside of the house.

There are three doors to my house, front, back, and side door to the garage.  To get consistency in the images, the IR camera scale was locked to a range of 60 to 71°F.
  The two pictures below are for the back door.  It is a raised panel wood door with single pane glass with a storm door just outside of it. It is immediately clear that the door is a much worse insulator than wall surrounding it.  Also, the raised panels (which are thinner than the rest of the door) are almost as bad as the glass when it comes to insulation.

The front door, show below, has the same problem.  The raised panels are very poor insulators, but even the heavier door sections are not as good as the walls nearby.  To make matters worse, both the front and back doors seem to be leaking air from the bottom seals.  The front door also has a glass screen door outside of it.
Heat loss depends on both the insulating value and the area (size) as well.  So a small spot on a wall (for example) that is poorly insulated is not as important as a larger area, like these doors.  So replacing the doors really should be a priority.
   But doors are very expensive.  A new front door would costs many thousands of dollars to buy and install.  A new rear door would be slightly less expensive, but still likely to cost thousands of dollars.  So replacing the two doors could exceed $6,000.  In contrast, the complete house was air-sealed and had blown-in cellulose insulation installed for $5,000 a few years ago.
   The additional problem with replacing the doors is that while they will likely be improved, they might still only be an R3 or R4 equivalent in insulation which is still far less than the R13 that is typical for 2×4 walls.  So a lot of money would be spent and the IR images might still look bad.
   One alternative is to get a new storm door with double pane insulated glass.  That would probably cost $400 and be relatively easy to install.
    An additional, and ambitious plan would be to build my own highly insulated door of my own design.  I'd love to use more than the standard 2" of thickness typically allocated to a door and expand it to the 4" space that is available, but getting a door knob that wouldn't hit the storm door would be a challenge.
   A last alternative is some sort of highly insulating inside panel to improve the door. Insulating Art anyone.?

The door to the garage, above, looks better than the other doors, but that is only because it is right now opening into a semi-heated (50°F) space.  The door is no better than the other doors, it just isn't being challenged.

  One quick test was done on the three doors using a single point IR thermometer (Radioshack 22-325).  The measurements were made on the middle of the raised panels for the front and back doors and on the glass for the side door.

63°F Front door
62°F Back door
65°F Side door

By way of contrast, the front door has a sidelite that I insulated with 2" of rigid foam (see separate post).  The raised panel on the sidelite measured 70°F or basically room temperature.  This was a huge improvement.


Monday, January 20, 2014

Achieving 54.5 MPG by 2025, "Off-cycle" Credits.

To make significant money, we all know that we have to get a job.  But if we just need a small bit of money (say to tip the paperboy), we might meet our goal by looking under the sofa cushions for a bit of loose change.
It turns out that the same is true for the EPA’s 2025 challenge of reaching 54.5 mpg for personal vehicles.  Mostly car companies will need to do the hard work of improving the efficiencies of engines and transmissions, lightweighting the vehicles, adding hybrid technologies, adding some  diesels engines to the mix, etc.  But in the equivalent of loose change under the sofa cushions, the EPA has created something called “off-cycle” credits.

The EPA recognizes that not everything that improves efficiency shows up in their standard “2-cycle” fuel efficiency test used for CAFE.  So they have created these special “off-cycle” credits for car companies to encourage these valuable efficiency improvements that are not adequately represented in the test.

Before getting into the credits, there is a big of jargon to get through.  It turns out that the EPA doesn’t develop its rules in terms of mpg, but it uses grams of CO2 emitted per mile.  The goal is to get vehicles to emit much fewer grams of CO2 per mile by 2025.  The specific target depends on both the size of the vehicle (so-called footprint) and whether the vehicle is a car or a truck.  The lowest target is for small cars (think Honda Fit) which must achieve 144 grams of CO2 per mile.  Compared to the goal of 144 gCO2/mile, the off-cycle credits are small, say 1 or 2 gCO2/mile, but every little bit helps when trying to reach a goal.

The final rules are contained in document 2012-21972.pdf which is a massive 578 pages.  There is some additional insight into this process in a document called AllianceCommentson2017NPRMFINAL2.pdf where the Alliance of Automobile Manufacturers are commenting on proposed EPA regulations.

The list of “off-cycle” credits includes.

A/C Improvements: A/C can be made more efficient by reducing blower speeds and evaporator temperature and this can significantly improve gas-mileage in a way not reflected in the 2-cycle testing. These credits can be up to 5.0 gCO2/mile for cars and 7.2 gCO2/mile for trucks.

High Efficiency Exterior Lighting:  Energy can be saved in vehicles by switching from incandescent bulbs to LED technology.  If the manufacturer can reduce electricity consumption from the bulbs by 100 watts, they will be rewarded with a credit of 1.0 gCO2/mile.  These lights include the high and low beams as well as the parking/position, tail, and license plate lights.  

Waste Heat Recovery: Most, perhaps more than 65%, of the energy in gasoline is converted to waste heat rather than useful work.  If that heat energy could be recovered using either a thermoelectric technology or rankine cycle technique, the overall efficiency of the vehicle would improve.  As of yet, no commercial systems have been developed.  But if a system could be developed that recovered 100 watts of power, the vehicles manufacturer would be rewarded with at 0.7 gCO2/mile credit.  A 200 watt system would produce twice the credit.

Solar Panels: OK, so we all know that it is impractical to try to run an EV off of vehicle mounted solar panels, because they are too small.  But that is not to say that they don’t have some value.  The EPA figures a 75 watt solar panel is worth 3.3 gCO2/mile when used to charge the battery and 2.6 gCO2/mile when combined with cabin ventilation.

Active Aerodynamic Improvements: These are technologies like active grille shutters and active air dams.  If the technology can reduce Cd by 3% in cars, a 0.6 gCO2/mile credit will be awarded or a 1.0 gCO2/mile credit on trucks.  If, by some miracle, the technology can provide 20% improvement, up to 7 gCO/mile in trucks will be given.

Engine Start/Stop: Vehicle manufacturers have long complained that the value of Start/Stop technology is not adequately reflected in the EPA mpg Window Sticker, and that is likely to continue to be the case.  But at least the technology will be given some credit in the CAFE calculations.  That credit will be 2.5 gCO2/mile for cars and 4.4 gCO2/mile for trucks when start/stop is combined with an electrically driven pump that can keep heat flowing to the passenger compartment with the engine stopped.  If no pump exists, the credit is worth 1.5 gCO2/mile for cars and 1.9 gCO2/mile for trucks.

Active Transmission Warm-up: Cold oil in a transmission, differential or transfer case significantly reduces vehicle efficiency, particularly on short trips.  Technologies exist to transfer waste engine heat to these driveline components to accelerate their warm up and allow them to operate more efficiently.  Credits of 1.5 gCO2/mile for a car or  3.2 gCO2/mile for trucks are available.

Active Engine Warm-up: Other technologies can be used to actively warm the engine up more quickly and get credits of 1.5 gCO2/mile for cars and 3.2 gCO2/mile for trucks.

Thermal Control Technology:  Additional credits are available to keep passengers comfortable in ways that reduce air conditioning loads: improving window glazing up to 2.9 g/mile, active seat ventilation 1.0 g/mile, solar reflective paint 0.4 g/mile, passive cabin ventilation 1.7 g/mile, and active cabin ventilation 2.1 g/mile for cars.  Truck credits are 3.9, 1.3, 0.5, 2.3, and 2.8 respectively.

All these credits together are not allowed to exceed 10 gCO2/mile, which for a 144 gCO2/mile small footprint car would represent about 7%.  

So these off-cycle credits will never be a huge factor in meeting the CAFE goals.  But just like a little change from the sofa cushions can help you out on occasion, these off-cycle credits might be just what the car companies need to meet some of their CAFE goals.


Postscript:  There are some additional interesting programs listed where the EPA deviates from a “merit” based argument to a more pragmatic argument.  The EPA clearly sees some technologies as winners despite their frequent claims to be technology neutral.

One of the more interesting programs is called “Advanced Technology Incentives for
Full-Size Pickup Trucks” where the EPA wants to encourage hybridization of “full-size” pickups early on in the 2017-2025 program.  They see early deployment of this technology as key to its development and introduction to the marketplace.  The EPA lists hybridization of trucks as a “game changing” technology.

If truck manufacturers implement “mild hybrids” in at least 20% of their full-size pickup trucks starting in 2017, they will be rewarded with a 10 gCO2/mile credit.  For “strong hybrid” implemented in at least 10% of their full-size pickups starting in 2017, there is a 20 gCO2/mile credit.  

Call me skeptical, but if Ford, Dodge, or GM was planning on using this incentive requiring 10% or 20% or full size pickups to be hybrids in 2017 (3 short years away), I would expect to see some “concept” vehicles showing up at auto shows with hybrid technology.   In July, Ford claimed that they would produce a hybrid F-150 by 2020, only one year before the credit expires.  So I suspect this offer will be left on the table by the truck makers.

One other interesting policy is that vehicles that are EVs/PHEV/FCV/CNGV get credit for more than one vehicle with an “Advanced Technology Volume Multiplier”.  EVs and FCV get 2 credits starting in 2017 phasing down to 1.5 in 2021.   PHEV and CNGV get a multiplier of 1.6 in 2017 phasing down to 1.3 in 2021.

EPA claims to be “technology neutral” in their pursuit of better fuel economy and lower GHG emissions.  That seems to be true of much of their policy making, but there are some glaring examples of “technology preference.”
1) EVs don’t need to account for upstream GHG emissions (ICE don’t either, but their upstream CO2 emissions are much lower than for EVs powered by a mix of grid electricity).
2) Full size pickups can get special credits for hybridizing their vehicles.
3) EVs get counted twice which is especially biased because they are counted a 0 gCO2/mile vehicles.

Personally, I tend to agree with these EPA rules that encourage technology that I believe is the key to increased energy security and lower emissions.  However, I don’t see how the EPA can make the case that these programs are technology neutral.

But with the EPA allowing each EV sold to count as two 0 gCO2/mile vehicles, there would seem to be a significant incentive for the car companies to produce EVs.

Saturday, November 2, 2013

Solar Energy and Net Metering.

I hate being wrong, but I appreciate being corrected by my friends so I don't continue to tell others the same wrong information.  Let me explain.

A work colleague is getting photovoltaic solar panels installed and we got into a discussion of "net metering".  Wait, don't stop reading now, I promise to keep this short.

"Net metering" is a simple rule that says, if the utility charges you, say 16 cents per KWH (kilowatt-hour) for electricity that you consume, then they must pay to 16 cents per KWH for any electricity you produce.   It is basically a fair-is-fair or KWH for KWH trading between you and the utility.

But what happens if you produce excess electricity.  If the power company can buy electricity for, say, 4 cents per KWH on the open power market, why should they pay you, say, 16 cents per KWH for your excess solar power.

So my understanding was that that the utility would only pay wholesale rates for excess electricity, say 4 cents/KWH.  My colleague's understanding was that you got paid retail rates for excess electricity, say 16 cents/KWH. 

It turns out that we were both right.  Or more exactly, I was right 4 years ago (when my system was installed) and my colleague is right now.

Here is some data culled from my electricity bills for the last six years.  The first thing to note is that I don't produce excess electricity every month, so there are a lot of holes in the data.  The second thing is that I excluded some other data due to accounting issues (these bills are basically hand processed, the automated billing can't handle it).

Prior to 2010, the data shows I was paid a variable wholesale rate that was about 4 cents/KWH in 2009, and a little higher in 2008.  This is a small fraction of the 18 or 19 cents/KWH that the utility was charging me for electricity when I bought it.  Long story short, I was giving away my solar power to the utility for peanuts.

After 2010, the new net metering regulations required the utility to pay me retail rates which has been just below 16 cents for the last four years.  This is the same rate (roughly) that the power company charges me, and four times what I was getting in 2009 for my excess electricity. This is not a huge sum of money (never more than $20 in a single month), but still a nice benefit for owners of solar panels and one more enticement for others to do the right thing and get solar panels...ya know, global warming, energy security, pollution, yada yada yada.

The kicker is this.  You cannot make money from this system.  The "credits" that appear on your bill in terms of dollars can never be paid out in cash.  The money always stays with NSTAR, one way or another.  Most likely you will use credits earned in the summer to help offset your bill in the winter, which is awesome.  If you consistently over produce, your credits can be applied to someone else's bill, e.g. a family member or your church.

The rules about net metering can be found here http://www.mass.gov/eea/grants-and-tech-assistance/guidance-technical-assistance/agencies-and-divisions/dpu/net-metering-faqs.html but it is not for the casual reader.   Let me end with a sentence from that web page.

"Net metering credits are calculated in a complex and detailed manner"


Thursday, October 31, 2013

Switch 3-Way LED Bulb

If you are like me, you've probably already switched over to CFLs and/or LED bulbs for their efficiency, but have one or two light fixtures where you just can't find the right bulb for the job.  For me, that challenging light fixture is right above my desk as I am typing this.

The first challenge with the fixture is that it is a 3-way bulb fixture.  You know the kind, one click to low brightness, second click to medium brightness, third click to maximum brightness, and fourth click to off again.  The second challenge is that it has a relatively short harp (the metal piece that goes around the bulb and holds up the shade).  This means that the replacement bulb has to be realtively short and the CFL 3-way that I purchased a few years ago never worked because it didn't fit.  Not willing to use an incandescent, I have been using a 60 Watt equivalent CFL.

The image below shows the Switch LED to the right and a 3-way CFL to the left.
The most obvious difference is the height.  The CFL is 6.5 inches long whereas the LED is 4.5" long.  Importantly, this means that the LED bulb actually fits in my light fixture.  This is fantastic because I have not had a proper 3-way bulb installed for about 4 years.

The next most impressive thing is the weight of the LED, 10.2 ounces (289 grams).  That is more than twice as much as the CFL at 4.9 ounces (140 grams) and probably ten times heavier than an incandescent bulb. 

Part of the reason for the high weight of the Switch LED is that it is liquid filled.  This liquid pulls heat away from the light emitting diodes which is critical to keeping them cool which is critical to long life.   This is a big issue with LED bulbs.  Although LED bulbs are naturally much cooler than incandescent bulbs,  the truth is that LEDs are much more sensitive to heat.  As a result, many LED bulbs are not suitable for enclosed light fixtures.  The excessive heat build-up for an LED in an enclosed fixture would greatly shorten the bulb life.   Switch claims that their LED bulbs can be used in an enclosed fixtures which is great.

The real headline for this bulb is that it produces the same light as a 100 watt incandescent while using only 20% of the energy.
   30/70/100 watt, incandescent
   11/18/23 watt, CFL (shown above)
    6/13.5/19.5 watt, Switch LED

So not only is the Switch LED more efficient than the incandescent, it is significantly more efficient than the CFL.

The other number of importance is the amount of light output which is measured in Lumens.
   305/905/1300 lumens, incandescent
   300/800/1100 lumens, Switch LED
So the Switch LED is a little less bright than a traditional bulb, about 15% less on its highest setting.  But I don't think that is too noticeable.   I don't have the numbers on the CFL since it was produced before the EPA started mandating lumen labeling on bulbs.

What's that, price,  [cough, cough] you want to know the price? You might want to sit down first.  Ah well, it was $45.  Yes I know that is a lot more than the $2 for an incandescent, and more than the $14 for a 3-way CFL.  However, there are some other things to consider.

Firstly, Switch just introduced a new line of less expensive bulbs, that are more like $20 per bulb than $50 per bulb.  This new line isn't shipping yet, nor does it have a 3-way model.  However, I think it is reasonable to expect a $20 3-way LED bulb within the next year.  Secondly, these bulbs should last 25,000 hours or about 12 times longer than an incandescent.  To do a little math, 12 incandescent bulbs at $2 each is $24.  So if the LED price comes down to $20, the price is more comparable. 

One more piece of math, there are 8760 hours in a year.  A 100 watt incandescent bulb running for a year would consume 876 KWH, or (at $0.15/kwh) $131 worth of electricity.  By contrast, the LED equivalent would only consume $26 worth of electricity.   So if the price of the bulb plus electricity is considered, the LEDs are not as expensive as you might think.  In fact, for heavily used bulbs, LEDs bulbs are much less expensive than incandescent bulbs.

To wrap things up, let's talk about the subjective aspects of the bulb.  Personally, I like the look of the LED bulb a lot more than the curly CFL bulb.   The light color of the LED is pleasing, it is instant on, and dimmable (not that you would with a 3-way).  The light distribution pattern seems to be quite uniform, which is a weakness for some LEDs that are naturally more directional than an burning hot filament.

Overall, I'd say the Switch LED is a winner, once the price is down to $20 anyway.

For reference, the Switch LED number is A23WY1FUS27A4-R and the CFL is a LightWiz S23WL3 or H23327 bulb.