Data can only be exported by setting up a daily email. That data can be opened in Excel or Google Sheets and a graph created. This seems a little cumbersome and I wondered if there isn't a better way to do it.

The Vision
A web page that shows the energy usage history for the device plugged into the WeMo Insight that is automatically updated daily when WeMo sends out the daily email.The Result

The result can be seen in the image above and in the following links for four WeMo Insight devices I have in my house.
If you think you would like to do the same thing the steps are below.
The Steps
There are a number of steps that are needed to make this happen.Step 1: Configure the WeMo Insight to send out a daily email.
Step 2: Automatically save the email attachment
Step 3: Automatically update the data set daily with the new data
Step 4: Automatically update the website graph
There are a number of different approaches that can be used to make this happen. I choose to use all tools from Google to execute the project from End to End. 1) The WeMo insight sends an email to my Gmail account, then 2) a custom Google script looks for new emails and automatically saves the attachments to my Google Drive, then 3) in Google drive, I have a Google Sheet (their equivalent of Excel) that contains a custom script that automatically updates the new data from the CSV file. And lastly, I have a Google Chart that is embedded in a blog post that is connected to the Google Sheets file.
Step 1: Configuring the WeMo Insight to Export data
It is fairly straight forward to get the WeMo Insight to send out a daily email.
- Click the menu button (three stacked squares)
- Click "Edit Device"
- Select the WeMo device of interest (there doesn't seem to be a way to do all at once.)
- Select "Data Export"
- Enter the email address
- Turn on "Scheduled Export"
- Select the interval, e.g. Daily
- Optionally, you can test this setup by clicking "Export Now"
If all goes well, you should get an email with an attached CSV file just after midnight. This should happen every day. One frustration I have with the app, is that if you later return to this screen, it might not show the correct settings like email address. Don't worry about that, it seems to work fine.
The CSV file contains three different types of data
- Header showing the device information
- Daily energy information including how long the device has been ON and OFF
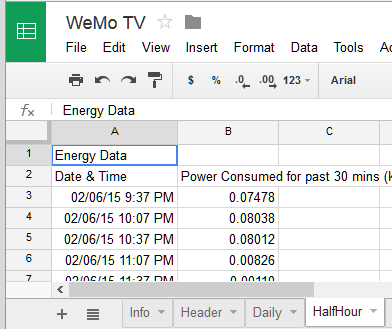
- Half Hourly information, which is just the KWH consumed.

Step 2: Automatically save the email attachment
This step was very easy thanks to Amit Agarwal's script that automatically saves attachments. I made two minor tweaks to his work and created my own version of the script . I added one field to say who to look for emails from, which is "WeMoExport" in the case of the WeMo emails. I also added a field to look for emails no older than 2 days. Amit's script processes data every 15 minutes. I really think it should just be done once a day at 1am, but I left this alone. If you like the script, kick over a couple of bucks to Amit, I couldn't have done this without him.
NOTE: Google drive allows multiple files with the same name. So each day a new file will be added with the same name as the old file. This is typically not allowed in the MS Windows World, but it looks like Google cares more about some randomly generated file number than the file name. Which will actually be helpful later.
Step 3: Update the data set daily with the new data
Data will exist in two locations. The historical data will be maintained in a Google SpreadSheet and the latest data will be on your Google Drive. I built a custom Google SpreadSheet has a custom script that loads the new data (based on a filename) and combines it with existing data. This is necessary because the Belkin Conserve only has a "rolling" 30 day window of data, so to see older data it is necessary to log it into the Google Spreadsheet before it disappears.
The script separates the data into "Header", "Daily" and "Half Hourly" information on separate sheets within the spreadsheet, as shown in the next three images.


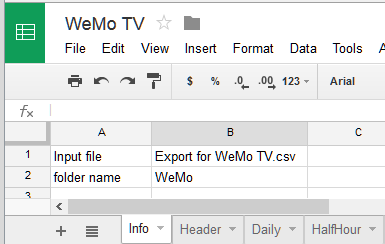
 There is an "Info" sheet that you must update with the filename and directory of your data.
When you copy this sheet, delete all the data on the Daily and HalfHour sheets, but leave the header and the first row of data. I'm not sure if the script will fail if there is no data in the sheet. You can kill the one line of old data later after it has been automatically update. If you want to, you can add data to this sheet manually, but note that it will automatically sort the data when the script runs.
There is a new menu added to the spreadsheet called "Update". The first time it is run, click on "Step 1" and authorize access and then "Step 2" to launch the script for automatic update. You can even click on "Update from CSV file, now" to load the latest data into your spreadsheet. But this should happen automatically within the next 15 minutes even if you do not do anything.
Step 4: Update the website graph
The data can be displayed on any website using Google Charts, which has nothing to do with Google Sheets, it is completely different. I used my existing eBlogger account as the host for my charts.
Google Charts is a very powerful tool. To get the chart to work with a specific data set, there are two steps.
Google Charts is a very powerful tool. To get the chart to work with a specific data set, there are two steps.
Step 1: The Google Spreadsheet from step 3 above needs to be shared
Step 2: The file number needs to be updated inside of the HTML code.
The javascript code that makes the charts is contained within each of the following examples.
They are all the same except for the "key" number discussed next.
Updating the File Number
Embedded inside the HTML JavaScript is the name of the file which looks something like this one.
'https://docs.google.com/spreadsheet/ccc?key=1xhRJ2xOhO0GP4f3bH70kkExXkhzKLo8hvoxjMG1UsN0&usp=drive_web&gid=0#');Just do a search for "docs" and you will find it. The important part is the section after "key=" and before "&usp". In this particular case it is.
1xhRJ2xOhO0GP4f3bH70kkExXkhzKLo8hvoxjMG1UsN0This number key needs to be updated with your number key for your file.
If your copy of the Google Spreadsheet is opened (the WeMo sheet that is to say), the number appears in the title bar.

Sharing the Google Spreadsheet
In order to have Google charts (the graph on the webpage) use data from the Google spreadsheet, first the spreadsheet must be made publicly viewable.
Open the Google Spreadsheet and in the upper right of the corner is a "share" button. Click it.

In the next dialog box click the "Advanced" button.

Then click the "Change" button on the next dialogue box.

On the final dialog box, click the button that says "On - Public on the web" and make sure the lower selector is on "Can view" so that people cannot modify your spreadsheet.


The Results
There are a couple of great results from this process.Firstly there is now a Google spreadsheet with all your energy usage data that extends beyond the 30 rolling window of the Belkin device. This can be a great resource to understand how much power is being consumed over longer periods of time, however it is not all that visual. I have purposely kept that spreadsheet very bare. It has only the data recorded by Belkin and no graphs. It doesn't even have the reduced data shown in the charts which are executed using a "query" command, like SQL.
Secondly, there are four graphs showing your data for a day, week, month, and year. Let me explain each of these.

The day chart shows the energy consumed in half hour increments yesterday. Don't look for the current data here as the Belkin only sends out data one a day just after midnight. So you are always looking at old data.

The week chart shows last week's energy usage from Sunday to Saturday. Here you can see my TV watching increases on the weekend. If you place your mouse cursor on any bar it will have a tooltip with more information. The graph shows both the standby power consumption and the power consumed when your device (in this case my TV) is on. This is really interesting to me because you can see the phantom loads that are wasting energy and not providing any service.

The month chart shows a rolling 30 day window of energy usage again with both the standby and running power consumption.

Overall, I loved doing this project because I learned a lot about Google scripts and Google charts. These will be useful on other projects. But now it is time for me to digest information about the power I consume and hopefully reduce it.
Great.. post Nice work Thank you for sharing.
ReplyDeleteI really love your approach of using all Google Apps. I wonder if there might be someway to get a public dashboard kind of view of whether the Insight has power draw or not - I would love to have a web page that showed whether the washer or dryer are on or off in the condo laundry room and have it shared with the whole complex.
ReplyDeleteNice script but do you have an update for the new Google Script / Driveapp command.
ReplyDeleteNo, unfortunately not. I have not dug back into this since Google Depricated the function I was using.
DeleteCould you please update the code dear John? It will very usefull for me
Delete(Me)SuT, the Belkin WeMo energy logging script is now working again.
DeleteSinning, the Belkin WeMo energy logging script is now working again. sorry for the long delay.
Deletecan u please tell me where i can edit the javascript - i cant find where i have to insert my own spread sheet key
ReplyDeleteIt is under "Tools" "script editor"
ReplyDeletemany thanks, but i cant find anything there where to put the string?!
ReplyDeleteby the way amazing Work!!! many thanks
This comment has been removed by the author.
ReplyDeleteAny chance we can update the script to scrub some data from the main file that the data is stored into?
ReplyDeleteRight now, the file we make in step 3 has the MAC id of the Wemo device. I find this to be a possible security flaw, especially since the file is open to the public.
Ludden I can look into scrubbing the MACi id.
DeleteThanks
John C. Briggs
Thanks, always best to be as secure as possible given the hackers these days.
DeleteAlso on my export, I noticed my 30min interval export has changed to a cumulative usage vs what was used in the last 30mins. Did your export format change?
Here is a brief snippet of the exported data.
02/15/18 5:30 AM 3.80877
02/15/18 6:00 AM 4.08465
02/15/18 6:30 AM 4.35615
02/15/18 7:00 AM 4.61467
02/15/18 7:30 AM 4.89857
02/15/18 8:00 AM 5.15652
02/15/18 8:30 AM 5.42859
02/15/18 9:00 AM 5.69878
02/15/18 9:30 AM 5.96814
02/15/18 10:00 AM 6.24464
02/15/18 10:30 AM 6.51611
02/15/18 11:00 AM 6.78409
02/15/18 11:30 AM 7.06848
02/15/18 12:00 PM 7.33647
02/15/18 12:30 PM 7.61755
I can derive the actual usage easily enough by just subtracting the current 30min data from the previous one. But I wasnt sure if this change is an error, some setting within Wemo that needs changed, or something.
Mine doesn't seem to be cumulative. I wonder if there was a firmware update to the WeMo Switch. I haven't updated mine for a couple of years.
DeleteI updated my firmware last week, and then within a week another firmware was updated. Recent one fixed my issues.
DeleteHi John ! I was looking for a way to monitor the data from my WeMo switch and found your script. I looked at the code and I have a few questions, I hope you don't mind answering :)
ReplyDelete1. Does "folder name" (under Info tab) have to be unique within my Drive or would it still work even if I have several folders with that name under different parent folder (and if that's the case, how does it get the right one?)?
2. Is the script actually looking for the "input file" in the "folder name" ? I had the impression that DriveApp.getFiles(); would look into the whole Drive, not a particular folder ?
3. The data files all have the same name and are stored in the same folder. How does the script know which one to parse daily ?
Thank you for your work on that script !
Just wanted to say thanks, this still works well, and was easiest enough to put together without too much poking and massaging.
ReplyDeleteGood to hear. I've wondered in anyone else was using it.
Delete